China's Ten-Year Tail: Air, Water, and Soil Behind a 4.8 Million Cancer Caseload
China reported 4.82M new cancer cases in 2022. PM2.5 runs 5.86× the WHO guideline, soil data froze in 2014, and the 30-year bill hits $6.1 trillion. SharpPost's three-vector read.

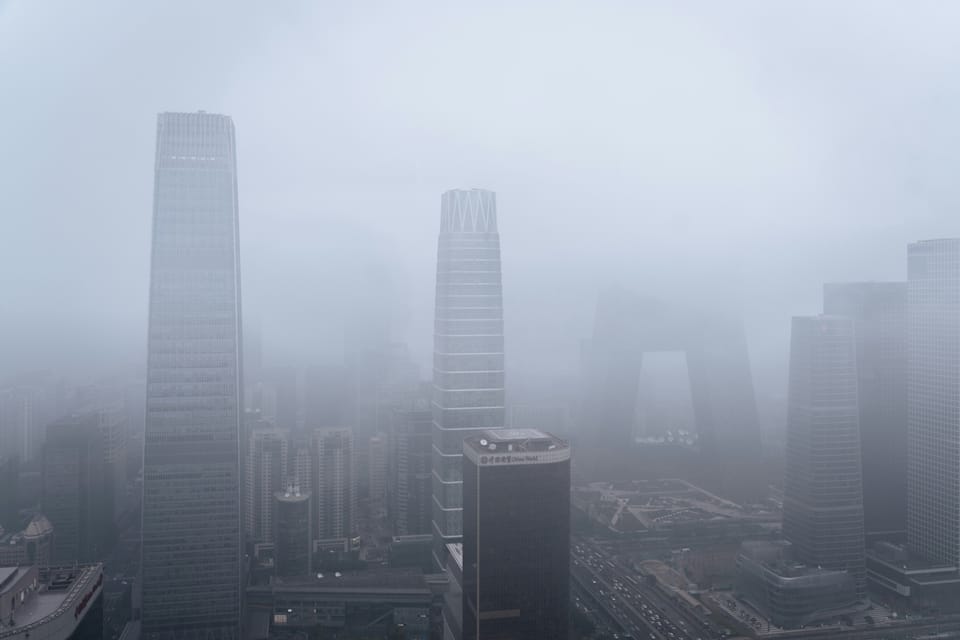
Air, water, soil: the ten-year tail behind China's high cancer rate
China's air, water, and soil pollution all fell across the past decade. Cancer incidence did not. The gap between environmental exposure and disease onset runs ten to twenty years. The 2022 registry tracks the environment of 2002-2012, which was the peak decade for coal-fired industrial expansion across Hebei, Shanxi, and Inner Mongolia.
China's National Cancer Center 2025 annual report set the baseline. In 2022, China recorded 4.82 million new cancer cases and 2.57 million deaths. Lung cancer alone accounted for 1.06 million new cases and 730,000 deaths. Add stomach, colorectal, esophageal, and liver cancers at 1.47 million combined, and those five cancers produce 52.4% of all new diagnoses. The environment side runs a parallel story. In 2024, national PM2.5 averaged 29.3 μg/m³, still 5.86 times the WHO 2021 guideline. Surface water rated Grade I through III covered 90.4% of monitored sections. The worst Grade V-and-below stood at 0.6%. Soil data last came out in 2014. Twelve years without an update. Treatment survival rates for the five leading cancers improved across the decade. Today's incidence peak still tracks the air and water of 2002-2012; the 2025 Cancer Center annual report will be the first to read cohorts who entered adulthood after the 2013 Air Ten launch.
Air Improved by More than Half. Lung Cancer Keeps Rising.
Air cleaned up. In 2013, when China rolled out the Ten Measures for Air Pollution Control, key cities averaged PM2.5 at 74 μg/m³. Eleven years later, the national mean sits at 29.3 μg/m³, about 40% of the starting figure. Good-air days hit 87% of the calendar. Heavy-pollution days fell under 1%. The benchmark shifts the picture. The WHO set its 2021 annual safe line at 5 μg/m³, and China still runs at six times that level. Europe and the United States crossed under 10 μg/m³ more than a decade ago. Beijing, Tianjin, and Hebei sit at 42 μg/m³, 40% above the national mean (see Exhibit 1). Compressing the next 10 μg/m³ costs more per unit than the first 30 μg/m³ did, because coal-heating inversion layers in the North China plain resist the end-of-pipe controls that cleared the easier margin.
Lung cancer did not track the air downward. In 2022, new lung cancer cases reached 1.06 million and deaths reached 730,000, each the largest share among all cancers. Globally, China's lung cancer incidence rate runs close to 1.8 times the world average. A 2025 Lancet Respiratory Medicine study sharpens the picture: more than 70% of the world's female lung adenocarcinoma patients live in China, and the male share sits near 70%. Air alone does not account for the gap. Four factors stack: outdoor PM2.5, indoor cooking fumes combined with winter coal heating across the north, secondhand smoke, and a higher prevalence of EGFR (lung-adenocarcinoma gene) mutations in East Asian populations. Attribution studies hold aging constant at roughly half the fivefold increase and split the remaining half across those four factors without assigning a single dominant one.
From 1990 to 2021, China's deaths from lung cancer tied to air pollution rose about fivefold. Half of the increase came from an aging population. Strip aging out, and the other half belongs to the air. At 29.3 μg/m³, PM2.5 still runs 5.86 times the WHO line, meaning the exposure side has not stabilized for the cohorts aged 45-55 today.
Water Meets the Standard. Digestive Cancers Don't Retreat.
Water took a similar path. The big chunk got fixed, and the residual runs harder. Across 3,641 monitored surface-water sections, Grade I-III water fit for drinking or irrigation now covers 90%. The worst Grade V-and-below came down to 0.6%. That covers the national average. The Yangtze and Pearl River basins run above 97% top-grade water. The northern Huai, Hai, and Liao basins sit at 83%, 74%, and 82%. North and south split by a wide margin. Compressing the last 1% to zero requires rebuilding drainage networks in the Huai and Hai basins, where industrial point-source outfalls concentrate and municipal sewage treatment still runs below the national coverage rate.
| Basin · Provinces | Grade I-III Water (%) | Colorectal | Liver | Stomach | Esophageal |
|---|---|---|---|---|---|
| Huai River · Henan/Anhui/N. Jiangsu | 83.5 | — | — | High | High |
| Hai River · Beijing/Tianjin/Hebei | 73.9 | High | — | — | — |
| Liao River · Liaoning/Jilin/Heilongjiang | 82.0 | — | — | High | — |
| Yangtze · Shanghai/Jiangsu/Anhui/Hubei | 98.1 | High | High | — | — |
| Pearl · Guangdong/Guangxi | 97.6 | — | High | — | — |
| National Total | 51.71 | 36.77 | 35.87 | 22.40 |
The water-cancer link reads looser than the air-cancer link. The connection holds, though. In 2022, colorectal, liver, stomach, and esophageal cancers together produced 1.46 million new cases, 30% of the total. The sharpest image of the past two decades is the "cancer village": clusters downstream of chemical plants and along heavily polluted rivers where entire villages showed cancer incidence far above the baseline. Professor Gong Shengsheng's team at Central South University documented 394 cancer villages between 1954 and 2015. The official list ran to 351. The list runs long. Clusters appeared along the Huai River basin, the North China Plain, and chemical-zone pockets in the middle Yangtze. After 2014, journalists and officials stopped using the term in public. Three causes overlap: treatment worked in some places, monitoring categories shifted, and the topic grew politically sensitive. The last comprehensive cancer-village census stopped at 2015; the underlying pollutant concentrations in those clusters have not been systematically re-measured since.
Local-scale research filled in a sharper picture. A 2024 study in the Journal of Environment and Health sampled China's urban and rural water bodies, including well water, and measured arsenic at an average 13 μg/L, 30% above the WHO drinking-water safe line of 10 μg/L. One detail matters. Those samples came from source water, not from the treated tap water that leaves municipal plants. Arsenic in the body links to skin, bladder, and lung cancer, a chain confirmed across international epidemiology. The 2022 revision of China's Drinking Water Sanitation Standard brought more trace pollutants under regulation. Below the county level, public disclosure of water-quality data stays thin: county-tier environmental bureaus are not required to post monthly water-quality bulletins in the format used at the provincial tier.
From Cadmium Rice to Bayan Obo: Ten Silent Years for Soil
Soil's real difficulty is visibility, not treatment. In 2014, the then-Ministry of Environmental Protection and Ministry of Land and Resources conducted a national soil pollution survey. The findings read heavily: overall exceedance 16.1%, farmland exceedance 19.4%, cadmium as the top pollutant with 7% of farmland sample points over the limit. That was the last national-level release. Over the next twelve years, authorities issued only partial indicators. A 2020 release placed the "safe utilization rate of contaminated farmland" at 91%. No full national survey returned. Specific cases linger in memory. A 2013 Guangzhou food-safety sampling of rice showed cadmium exceedance peaking at 44%. Production sites in Zhuzhou and Xiangtan in Hunan appeared in regulatory bulletins time and again. After 2021, sampling results at a similar scale stopped appearing in public. For 1.4 billion people whose diet centers on rice and vegetables, the data gap runs wide. No national-scale cadmium rice sampling dataset has appeared in public since 2021.
Farmland pollution is diffuse; mines are point sources. Rare-earth mining is the sharpest case of a point source. Bayan Obo in Baotou holds the world's largest light-rare-earth deposit. Its tailings pond exceeds 11 square kilometers and contains radioactive thorium, fluoride, and heavy metals. Downstream in Dalahai village and nearby areas, multiple independent studies measured elevated groundwater fluoride. Complaints about cancer and respiratory disease have surfaced in Chinese and foreign reporting for more than two decades. Ganzhou in Jiangxi carries a separate line. Ion-absorption rare-earth mining there requires pouring ammonium sulfate onto hillsides to leach out the metals, which leaves wide zones of acidified terrain and heavy-metal accumulation. In 2016, China's central environmental inspection group described Ganzhou's operations as showing "ecological damage shocking to witness." The two sites use different processes, and the residual exposure pattern runs the same way. The 2014 national survey remains the only dataset that counted Bayan Obo and Ganzhou exposure readings in a comparable national frame; no refresh has covered either site in the twelve years since.
Rare-earth enforcement has moved since 2021, when Beijing placed rare earths on its counter-list in the technology rivalry with Washington. The strategic weight of the resource rose. Balancing strategic supply against environmental enforcement is not a fresh question. The escalating rivalry enlarged the room local authorities give mining operations to operate outside standard oversight. Strategic returns flow to Beijing. The long-term health cost stays with residents in Baotou and Ganzhou. The two sides of that tradeoff are tracked in separate reporting channels and do not appear in a common government audit. The 2025 revision of the Soil Pollution Prevention Law includes a clause requiring periodic national soil surveys; whether that clause survives into the final version is the single observable test of whether national data returns.
Health Sits Last in Line
Over four decades, China built the world's second-largest economy on coal-fired power, steel, cement, and rare-earth mining. Air, water, and soil damage sat outside the production cost accounting. The 2013 air plan, the 2015 water plan, and the 2018 soil pollution law began pulling those externalities onto the national balance sheet, though only at the national level. Local government performance review still weighs GDP, employment, and fiscal receipts as the primary indicators. Residents' health sits outside the cadre evaluation matrix that determines provincial and municipal promotion.
Coal capacity reduction has run eight years and continues. Pressure sits on electricity prices, employment, and local fiscal receipts. Steel crude output held above 1 billion tonnes in 2024. Rare-earth mining quotas rose 5.9% the same year. Each sector directly employs hundreds of thousands of workers, and provincial fiscal receipts in Shanxi, Inner Mongolia, and Jiangxi depend on throughput from these industries.
These three sectors carry economic growth, employment, and strategic minerals at once. Treatment technology is available; the throughput targets in the existing five-year plans constrain deployment. National environmental spending runs near 1.8% of GDP, against the OECD average of 2%. Air quality has 1,547 national monitoring stations reporting by the minute, surface water has 3,641 sections reporting monthly, and soil data still stops at the 2014 survey. Twelve years without a comprehensive refresh. Air and water monitoring are budgeted as standing operations; soil monitoring runs on one-off survey appropriations that have not been reauthorized since 2014.
The $6.1 Trillion Economic Burden Through 2050
Quantifying environment and cancer on a common denominator changes the sense of scale. A 2023 JAMA Oncology study estimated China's total cancer economic burden from 2020 to 2050 at 6.1 trillion international dollars, the largest of any country (international dollars convert purchasing power across economies). Direct medical expenses amount to about 3.8% of GDP. Factor in lost productivity from illness and work-years removed by early death, and the figure climbs to 7.5%. At the household level, multiple studies converge on the same figure: 77.6% of cancer-affected families face catastrophic medical expenses, meaning a single illness drains household savings and typically forces liquidation of assets or borrowing from extended family networks.
Mortality figures face their own methodological dispute. The Global Burden of Disease project estimated 1.9 million premature deaths per year in China from air pollution (updated in 2025 Lancet Planetary Health). China's CDC in 2017 used a narrower accounting and produced 1.24 million, a gap of 660,000. The difference turns on whether to count ozone, indoor air, and secondary particulate matter as "air pollution." The two estimates describe the same phenomenon. The gap turns on whether ozone, indoor air, and secondary particulate matter count as "air pollution"; the 660,000-person difference is a definitional boundary, not a measurement dispute.
Three Paths for the Next Three Years
Viewed from early 2026, the years 2026 through 2029 point toward three plausible paths for China's environmental governance and cancer burden. The most probable path stays the course. PM2.5 lingers between 28 and 29 μg/m³. Grade V-and-below water holds at 0.6% without further descent. Soil data stays off the public record. The Cancer Center 2025 annual report shows lung cancer incidence up 3% to 5% from 2022. Rare-earth sites receive lighter environmental reporting under strategic priorities. The second path opens an upside. A third-phase air action plan launches, the soil-pollution law revision passes, and data disclosure resumes. Lung-cancer new-case growth slows to around 1% per year. The downside path hands environment to GDP. Rare-earth enforcement receives institutional waivers. Soil disclosure retreats further. By 2028, direct cancer medical spending alone reaches 6% of GDP. The three paths converge on one question: treatment pace versus information transparency. The fork arrives in 2027. The 2027 Soil Pollution Prevention Law revision vote and the 2025 Cancer Center annual report slope are the two leading indicators for which path lands.
The Reading That Arrives Ten Years Late
Stacking air, water, and soil together, no single track ranks as the hardest on its own. Each track carries its own pressable standard: PM2.5 in air, Grade V-and-below in water, cadmium exceedance and rare-earth tailings in soil. The real difficulty arrives when pollution enters the body and stops respecting bureaucratic boundaries. Air moves from nose to lung. Water mixes with rice and vegetables into the digestive tract. Heavy metals in soil enter vegetables before entering people. The respiratory, digestive, and renal systems receive all three loads at once. Monitoring and budgets divide by agency; the body does not. The 2025 Cancer Center annual report, due out this year, includes two readings worth watching: age-adjusted lung cancer incidence, still rising or leveling off; and non-smoking-female lung adenocarcinoma rates, approaching a peak or past one. Those two readings are the earliest lagging signal of whether the 2013-era air improvement has reached the cohort now in the 45-55 age band.
Fiscal capacity and policy paperwork are not the scarce items. The scarce items sit elsewhere. Restarting the national soil pollution detailed survey. Returning the cancer-village topic to public discussion. Breaking down the effects of the Air Ten and Soil Ten measures by risk category and population exposure. Without these steps, three-dimensional governance remains a headline indicator; the public has access only to aggregate figures published by MEE and the Cancer Center on annual cycles. With these steps, exposure-to-incidence attribution can move below the provincial level, and the 2022-2032 cancer cohort gains a policy response tied to the pollution layers it actually absorbed.
You read this far. You're not here for noise.
SharpPost delivers one weekly deep dive on geopolitics, finance, and tech — decoded for readers who want signal. Carefully selected, never noisy.