China’s Hidden Bank Bad Debt: Why Bloomberg’s $3 Trillion Estimate Matters
Bloomberg estimates China’s hidden bank bad debt at about $3 trillion. Official NPLs remain near 1.5%, but property, LGFV debt and weaker cash flow raise questions about bank asset quality.
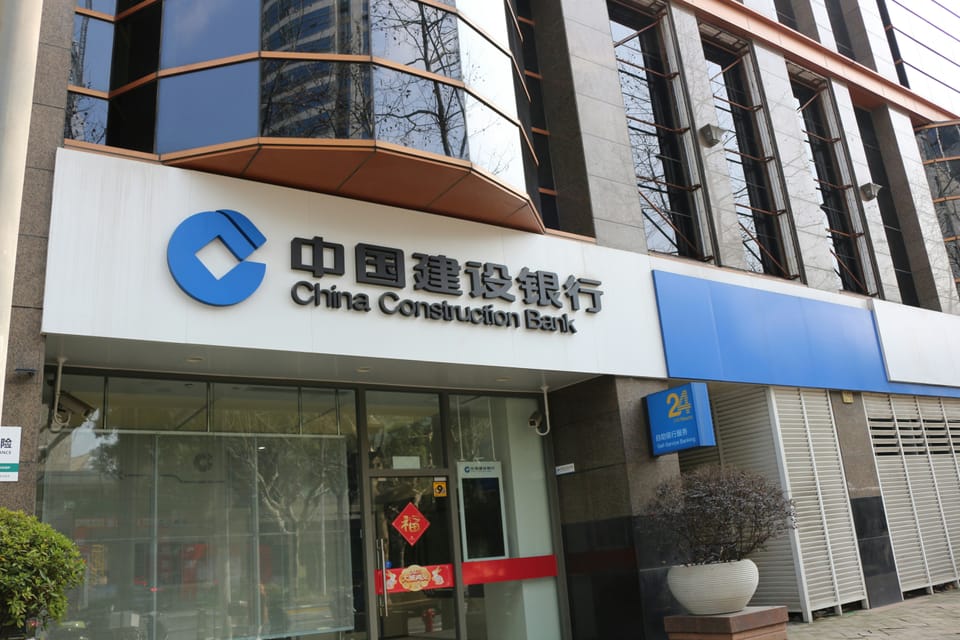
Bloomberg reported on May 12 that China’s banking system may be carrying about $3 trillion in hidden bad debt, equal to roughly 21 trillion yuan. The report cited estimates suggesting that the real bad-loan ratio could be close to 10%, with more severe assumptions putting it as high as 20%.
Chinese regulatory data give a much calmer picture. At the end of the first quarter of 2026, commercial banks had 3.7 trillion yuan of non-performing loans, or 1.51% of total loans. Loan-loss provisions stood at 7.5 trillion yuan, giving the system an official provisioning coverage ratio of 203.14%.

The gap turns on classification. Official non-performing loans are loans that banks have already recognized and reported as impaired. Hidden bad debt usually refers to loans outside that category where repayment capacity has weakened. Property project extensions, local-government debt swaps and corporate refinancing can all delay recognition.
Losses would be uneven and spread over time. Banks can extend maturities, restructure loans, sell collateral, use current profits or draw on provisions. Investors are focused on how much of the stress remains outside the official NPL figure.
Official disclosure and market estimate
Trillion yuan. Official NPLs are recognized problem loans; Bloomberg’s figure is an estimate of potential bad debt outside official statistics.
Why the official NPL ratio can stay low
A low NPL ratio can coexist with rising credit stress. In a bank-led financial system, recognition often follows the borrower’s cash-flow problem with a lag. Falling revenue, lower property prices and tighter local-government finances may first appear as extensions, renewals or restructuring.
The incentive is familiar across banking systems. Recognizing a large amount of bad debt at once damages earnings, capital and confidence. China adds another layer because banks, property developers, local governments and policy lending are closely linked. The ability to repay a loan can depend on land sales, fiscal transfers, refinancing channels and regulatory guidance as much as on the borrower’s business.
| Item | Figure | What it captures | Limitation |
|---|---|---|---|
| Official NPL balance | 3.7 trillion yuan | Loans already classified by banks as non-performing | Excludes loans still being extended, renewed or restructured |
| Official NPL ratio | 1.51% | Regulatory disclosure of recognized bad loans | Sensitive to classification timing |
| Bloomberg hidden bad-debt estimate | About $3 trillion | Market estimate of potential problem loans | Model-based estimate, outside official statistics |
| Loan-loss provisions | 7.5 trillion yuan | Buffer already set aside by banks | Coverage falls if the problem-loan pool widens |
The provision buffer depends on the size of the risk pool
Official figures show a provision coverage ratio of 203.14%, which means provisions are roughly twice the recognized NPL balance. That is a strong headline buffer under the current classification.
The picture changes if Bloomberg’s estimate is treated as potential risk outside official NPLs. Combining 3.7 trillion yuan of official NPLs with roughly 21 trillion yuan of hidden bad debt gives a risk pool of about 24.7 trillion yuan. Against 7.5 trillion yuan of provisions, coverage falls to about 30%. The calculation is a sensitivity test of coverage, separate from a loss forecast.
Provision coverage under wider risk assumptions
Based on 7.5 trillion yuan of loan-loss provisions. The stress cases compare coverage of a risk pool, separate from final loss estimates.
Where the stress is likely to sit
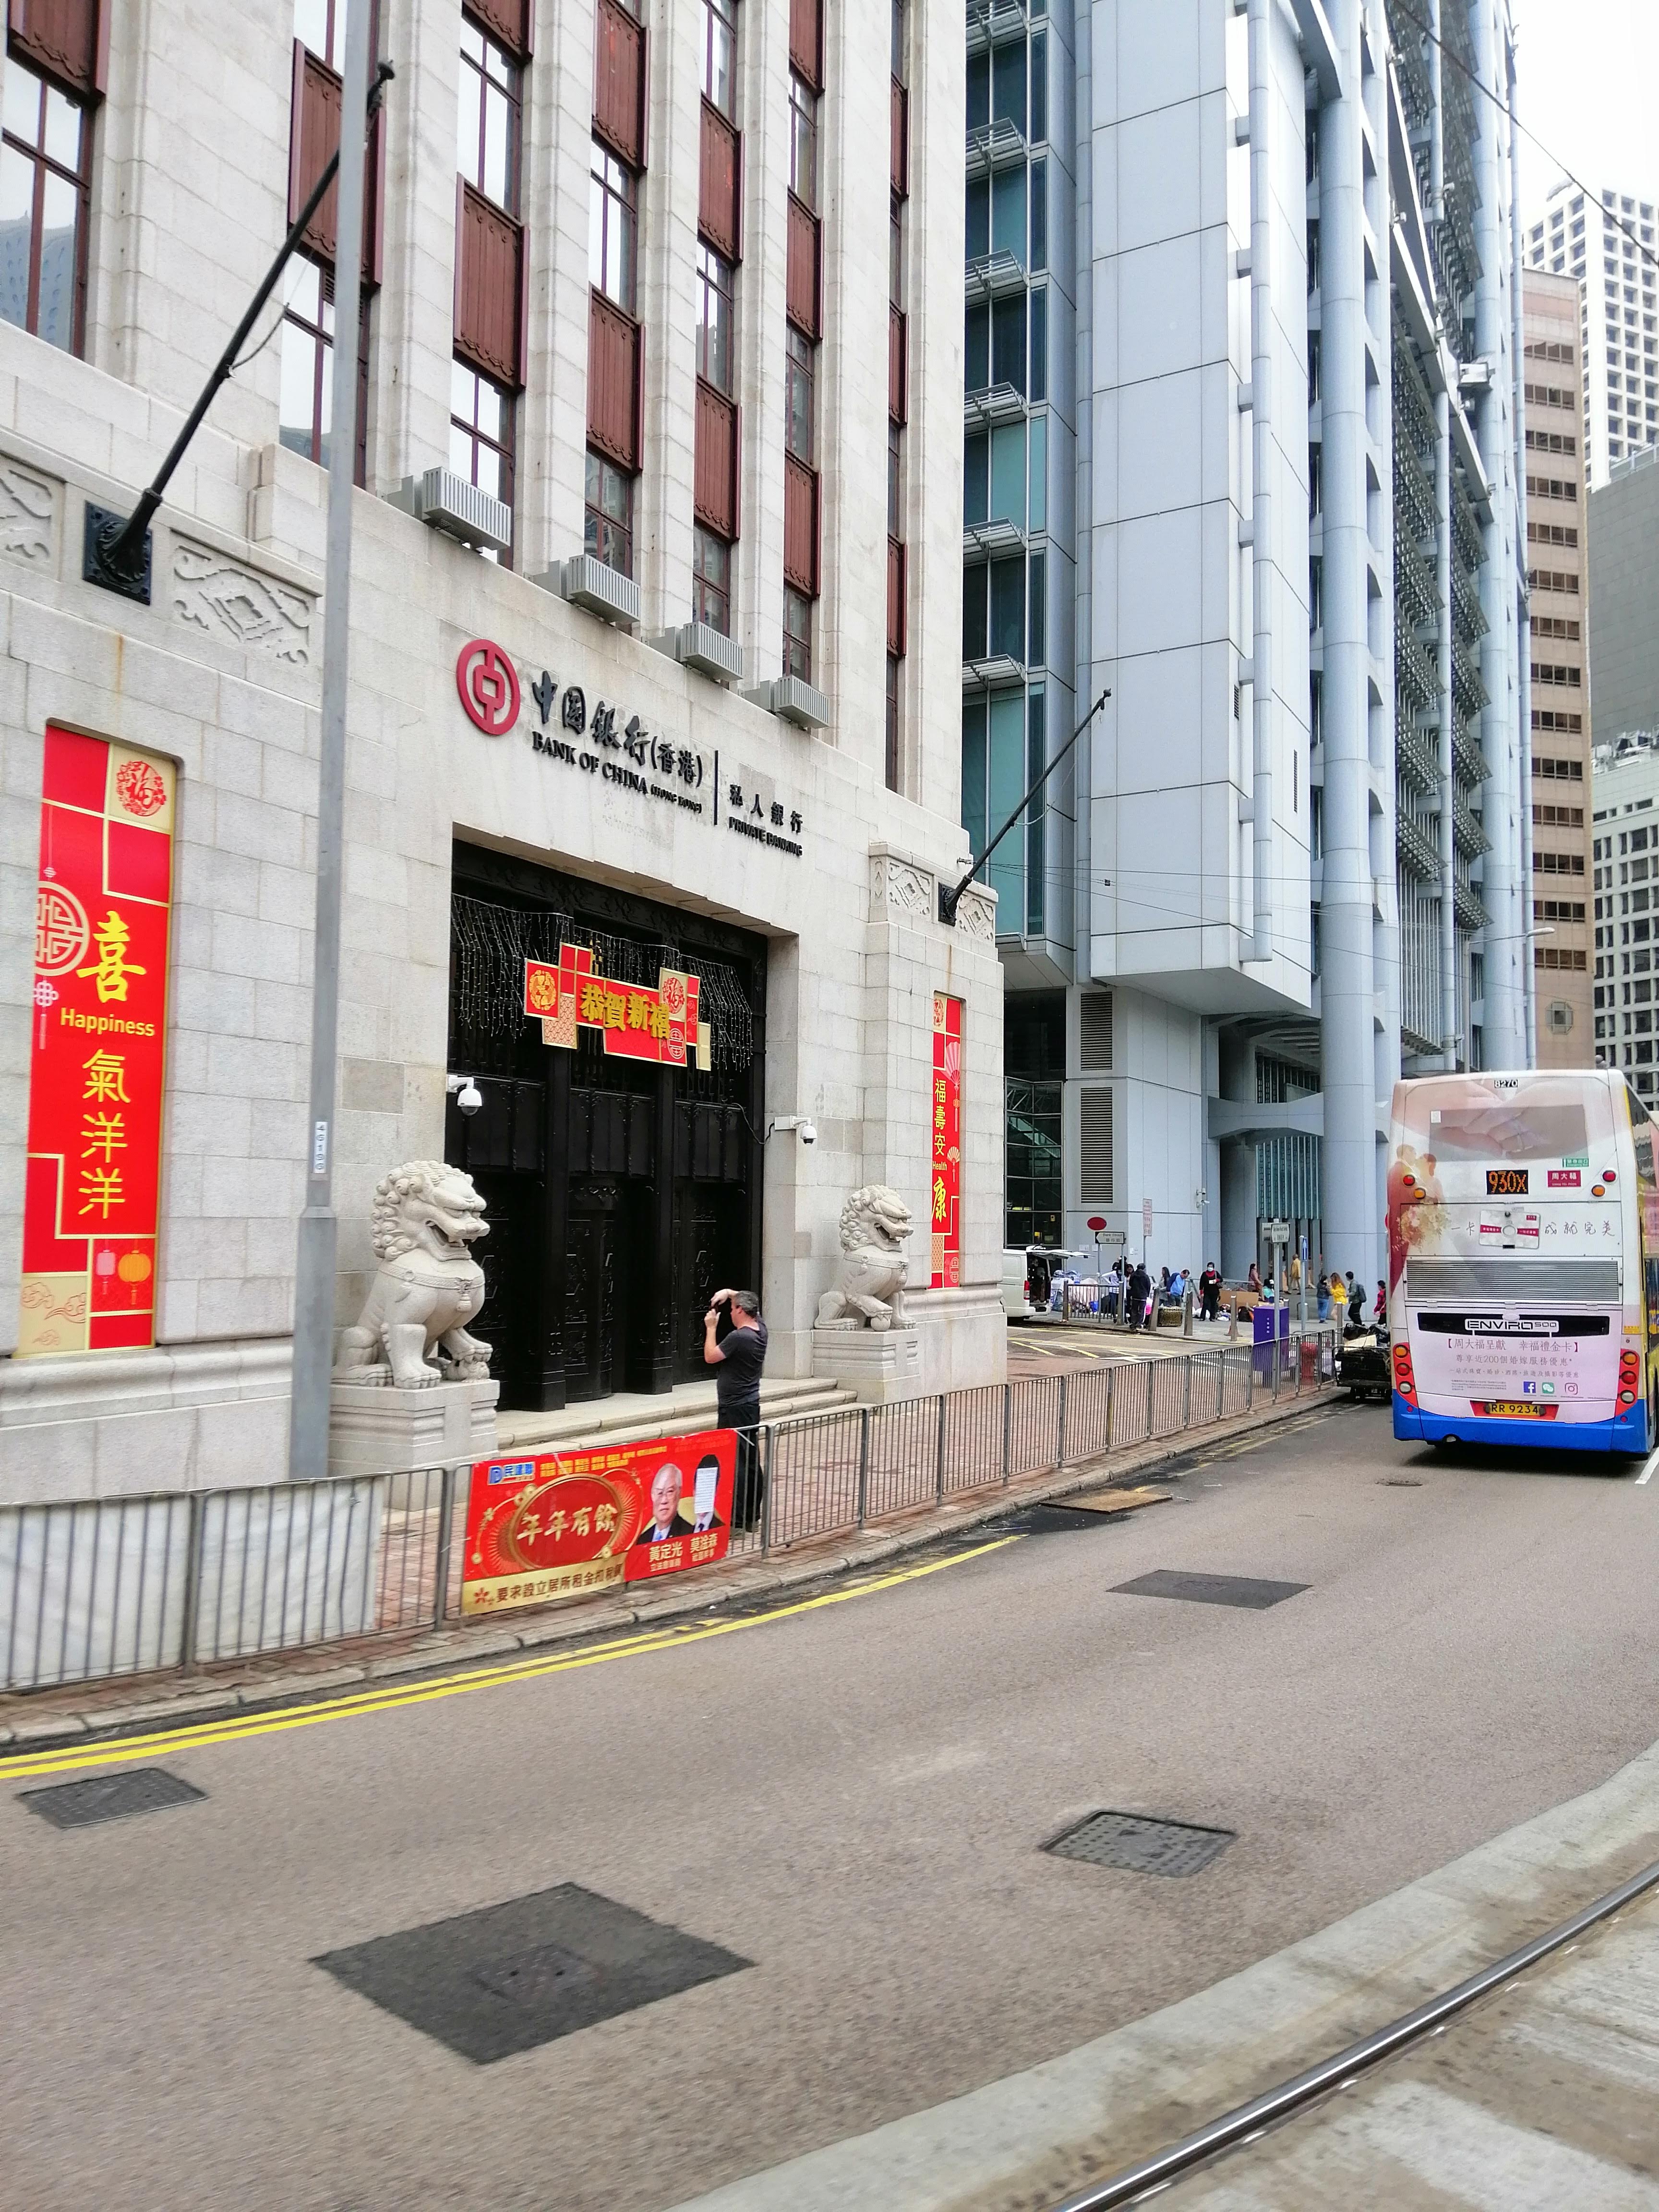
The most exposed areas are familiar to investors following China. Property development loans, mortgages and loans to construction suppliers are linked to property cash flow. Local government financing vehicles depend on land revenue, fiscal support and refinancing. Small-business loans and operating loans can stay current for some time through renewals.
Shadow-banking products, trust assets and other off-balance-sheet exposures add another layer. They may sit outside bank loan books, with the risk returning through wealth-management products, guarantees, credit lines and local rescue arrangements.
| Risk source | Typical sign | Pressure on banks | How it reaches households or firms |
|---|---|---|---|
| Property | Weak sales, stalled projects, developer cash shortages | Developer loans, mortgage quality and collateral values come under pressure | Home prices weaken and resale liquidity falls |
| LGFVs | Debt swaps, extensions, delayed fiscal payments | Longer maturities and lower returns on platform loans | Project payments, procurement and local services slow |
| Small firms | Renewed working-capital loans, interest paid while principal rolls over | Risk recognition is delayed | Credit becomes harder to obtain |
| Shadow banking | Trust, wealth-management and private credit products under strain | Off-balance-sheet stress can move back into bank balance sheets | High-yield savings products face more uncertainty |
Property remains the direct channel
China’s National Bureau of Statistics said real estate development investment fell 11.2% year on year in the first quarter of 2026. Sales area of newly built commercial housing fell 10.4%, while sales value dropped 16.7%. Funding for developers fell 17.3%.
The financing details are important for banks. Domestic loans to developers fell 23.7%. Individual mortgage loans fell 34.6%. Weak sales reduce cash recovery; lower funding weakens project completion; slower mortgage growth points to soft household borrowing demand.

Property indicators remained weak in Q1
Year-on-year change, January to March 2026. Unit: %.
Local debt swaps ease timing pressure
Local government debt is the other large pressure point. In November 2024, China approved a 6 trillion yuan increase in the local-government debt ceiling to replace existing hidden debt. It also said 800 billion yuan from new special-purpose bonds would be allocated each year for five years, providing another 4 trillion yuan for debt relief.
Debt swaps can lower funding costs and reduce near-term default pressure. They leave the cash-flow problem unresolved. If land sales, tax revenue and platform earnings remain weak, local governments still face a longer and lower-cost debt burden.
| Policy channel | Scale | Near-term effect | Medium-term issue |
|---|---|---|---|
| Higher local-government debt ceiling | 6 trillion yuan over three years | Refinances hidden debt through official bonds | Debt service remains with local governments |
| Special-purpose bonds for debt relief | 800 billion yuan a year for five years | Supports debt swaps and arrears clearance | May crowd out funds for new investment |
| Later-maturing shantytown renovation debt | About 2 trillion yuan | Avoids immediate recognition pressure | Still absorbs future fiscal capacity |
Profit is a thinner shock absorber
Bad debt can be absorbed through bank earnings, provisions, capital and fiscal support. Gradual recognition gives banks time to use current profits. A faster recognition cycle would require more capital and policy support.
Profitability has already weakened. Regulatory data compiled by Lianhe Ratings show commercial banks’ net interest margin fell from 2.08% in 2021 to 1.42% in 2025. Return on assets fell from 0.79% to 0.60% over the same period. Lower margins reduce the banking system’s ability to digest bad loans internally.
Net interest margins have narrowed
Commercial bank net interest margin. Unit: %.
How it reaches households and companies
For households and companies, hidden bad debt is unlikely to appear first as a deposit problem. China’s large state banks have strong policy support and substantial liquidity buffers. The transmission is usually slower: tighter lending, lower returns on conservative savings products, weaker local-government spending, slower corporate payments and weaker expectations for income and jobs.
Households: deposit rates may stay low and low-risk wealth-management yields may remain under pressure. Homes used as collateral may receive more conservative valuations.
Companies: banks are likely to scrutinize cash flow, collateral and sector exposure more closely. Small firms may still roll over credit, with approvals becoming slower and more document-heavy.
Local economies: debt swaps reduce short-term default pressure, while debt service can still constrain infrastructure spending, procurement, subsidies and public-project payments.
That mechanism can weigh on growth without producing a sudden banking crisis. Banks become more cautious. Companies delay investment. Households postpone spending. Local governments direct more resources toward debt management. The result is a slower economic repair.
The data to watch next
The official NPL ratio alone leaves the debate unresolved. Special-mention loans, restructured loans, overdue loans, provision coverage, net interest margins, property sales and local-government debt swaps will show pressure earlier. If several of these indicators worsen at the same time, a low headline NPL ratio will carry less weight with investors.
| Indicator | Why it matters | Pressure signal | Stabilizing signal |
|---|---|---|---|
| Special-mention loans | Early pool for potential NPLs | Share keeps rising | Stable or declining share |
| Restructured and extended loans | Shows delayed recognition | Rapid growth | New additions slow as cash flow improves |
| Provision coverage | Measures the bad-loan buffer | Sharp decline or heavy use | Stable high coverage |
| Net interest margin | Determines profit available to absorb losses | Further compression with weaker profits | Decline slows |
| Property sales and funding | Drives developer and supplier cash flow | Sales, mortgages and domestic loans keep falling together | Sales value and funding stabilize |
China’s banking system has policy backing, a high domestic savings base and state-owned lenders that can act as stabilizers. That lowers the chance of a classic banking panic. It also means losses can be stretched over time through lower margins, slower credit growth, debt swaps and fiscal support.
The gap between the official NPL ratio and market estimates will ultimately be tested by cash flow. Property sales, local fiscal revenue, corporate earnings and bank margins will decide whether the hidden bad debt is gradually absorbed or remains a drag on China’s recovery.
Sources:
Bloomberg via Yahoo Finance: China’s $3 Trillion of Hidden Bad Debt Prolongs Economic Pain
China News Service, citing NFRA data: Q1 2026 banking and insurance regulatory indicators
National Bureau of Statistics of China: Investment in Real Estate Development from January to March 2026
People’s Daily Online / Xinhua: China approves bill to raise local-government debt ceiling
Lianhe Ratings: 2026 commercial banking industry analysis, using NFRA historical data.
Images: Wikimedia Commons, Quintin Soloviev / CC BY 4.0; Cypp0847 / CC BY-SA 4.0; Yumeto / CC BY-SA 4.0.
You read this far. You're not here for noise.
SharpPost delivers one weekly deep dive on geopolitics, finance, and tech — decoded for readers who want signal. Carefully selected, never noisy.